
Ergonizer Changelog
Release notes for Ergonizer Software. The changes of the latest, not yet officially released version are usually already included in the intermediate versions (available via download).
Version 6.0.0 – not yet officially released (but coming soon)
Beta version
Version 6 is currently in beta and available to selected users only. If you are interested in beta testing, please contact us by email.
For a short introduction to the new features of version 6, see the Ergonizer 6 beta page, where you can also request access to the beta. We review all requests and will get back to you by email.
Version 6.0.0.852 (beta) – 2026-09-28
New features
Vector PDF export of Group Analysis: the group charts are exported as a multi-page PDF with scalable vector graphics, page numbers, and footers — sharp at any zoom level and in print.
Update hint in the status bar: Ergonizer checks for new builds periodically while it is running and shows a clickable hint in the status bar that opens the update dialog. Nothing is installed without your confirmation.
Values under the cursor in the status bar: while you hover the lactate chart, the status bar mirrors the values of every displayed test, color-coded per test; a right-click in the chart copies these values to the clipboard (tab-separated, ready for Excel).
Speed-based tests in Group Analysis: running and other speed-based tests are evaluated in their own units — critical speed values are computed for them, they are ranked separately from watt-based tests in the performance profile, and they are never shown in watts. Absolute \(\dot{V}\mathrm{O}_{2\mathrm{max}}\) is reported in l/min.
Improvements
Lactate outliers in the recovery phase: post-exercise lactate values can now be excluded from the curve fit as well; Ergonizer warns if this affects the Stegmann threshold. Outliers are drawn as gray points with an “Outlier” label, and clickable points are highlighted on hover (left-click opens the outlier menu).
Lactate chart: training zone bands and the recovery area are drawn translucently behind the curves and data points, and the hover legend is grouped per test with fixed curve colors.
Scientific notation: physiological quantities such as \(P\), \(v\), \(\dot{V}\mathrm{O}_{2}\), and \(\dot{V}\mathrm{La}_{\mathrm{max}}\) are rendered with italic symbols and proper subscripts in charts, tables, and reports.
Redesigned status bar with a flat look: its color reflects the application state (e.g. an active test), it updates immediately when switching tabs, and the background calculation shows an explanatory tooltip.
Report tables label watt columns as “Power output”, and zone abbreviations are printed in bold.
The training zone display (chart, tables, and panes) consistently follows the selected zone scheme, including the choice between 4 and 5 zones.
For tests whose lactate curve cannot be evaluated reliably (correction mode), the displayed LT and IAT now match the predicted training zones.
Switching the active test from Group Analysis now asks for confirmation in a clearer, modern dialog.
Beta access is granted automatically to customers with an active update license.
New application icon for Version 6.
Bug fixes
The Stegmann threshold is now found for considerably more tests (especially treadmill tests): if the smoothed recovery curve never returns to the end-of-exercise lactate value, the point where it does is now interpolated between the measured recovery values.
The Stegmann option stays available when entering recovery values for a new test.
After changing the data directory, background calculations no longer write into the previously used database.
Tests without an assigned discipline no longer cause errors when the sport is displayed.
Version 6.0.0.768 (beta) – 2026-09-11
New features
Group Analysis — a completely new analysis tab for evaluating results across your entire subject database. Compare distributions of thresholds, performance values, and anthropometric measures (height, weight, BMI) as violin plots with medians and sample sizes, including side-by-side gender comparison.
Performance profile: a radar chart in Group Analysis shows where individual tests rank (percentile) against the selected reference group, with gender-specific reference values and hover details per test.
Tests tab in Group Analysis: search and tick individual tests; the selection stays in sync between the list and the charts (highlighted, pinned, and grouped tests).
Print and export of Group Analysis: high-resolution, multi-page printing of the group charts with automatic scaling.
Training zone models: choose the zone standard (e.g. ACSM/ESSA) and the number of zones independently; names, abbreviations, and zone boundaries follow the selected model. With ACSM/ESSA the top zone starts at 90 % of maximum power and is drawn open-ended in the lactate chart.
Zone colors and color sets: the colors of the training intensities can now be edited per zone in the preferences and saved as named color sets that apply to screen and print alike.
New ergometry types: field rowing, roller ski classic, and roller ski skating, with matching units, protocols, reports, and training zones.
Blood glucose: record blood glucose values per stage and during recovery, with selectable units, and display them in the evaluation alongside lactate. The glucose chart now scales to the data, shades clinical ranges, and remembers the chosen unit.
RPE (Borg scales): capture ratings of perceived exertion per stage — overall, breathing, and muscles — on the Borg 6–20 or CR10 scale, with graphical display and language-aware scale anchors.
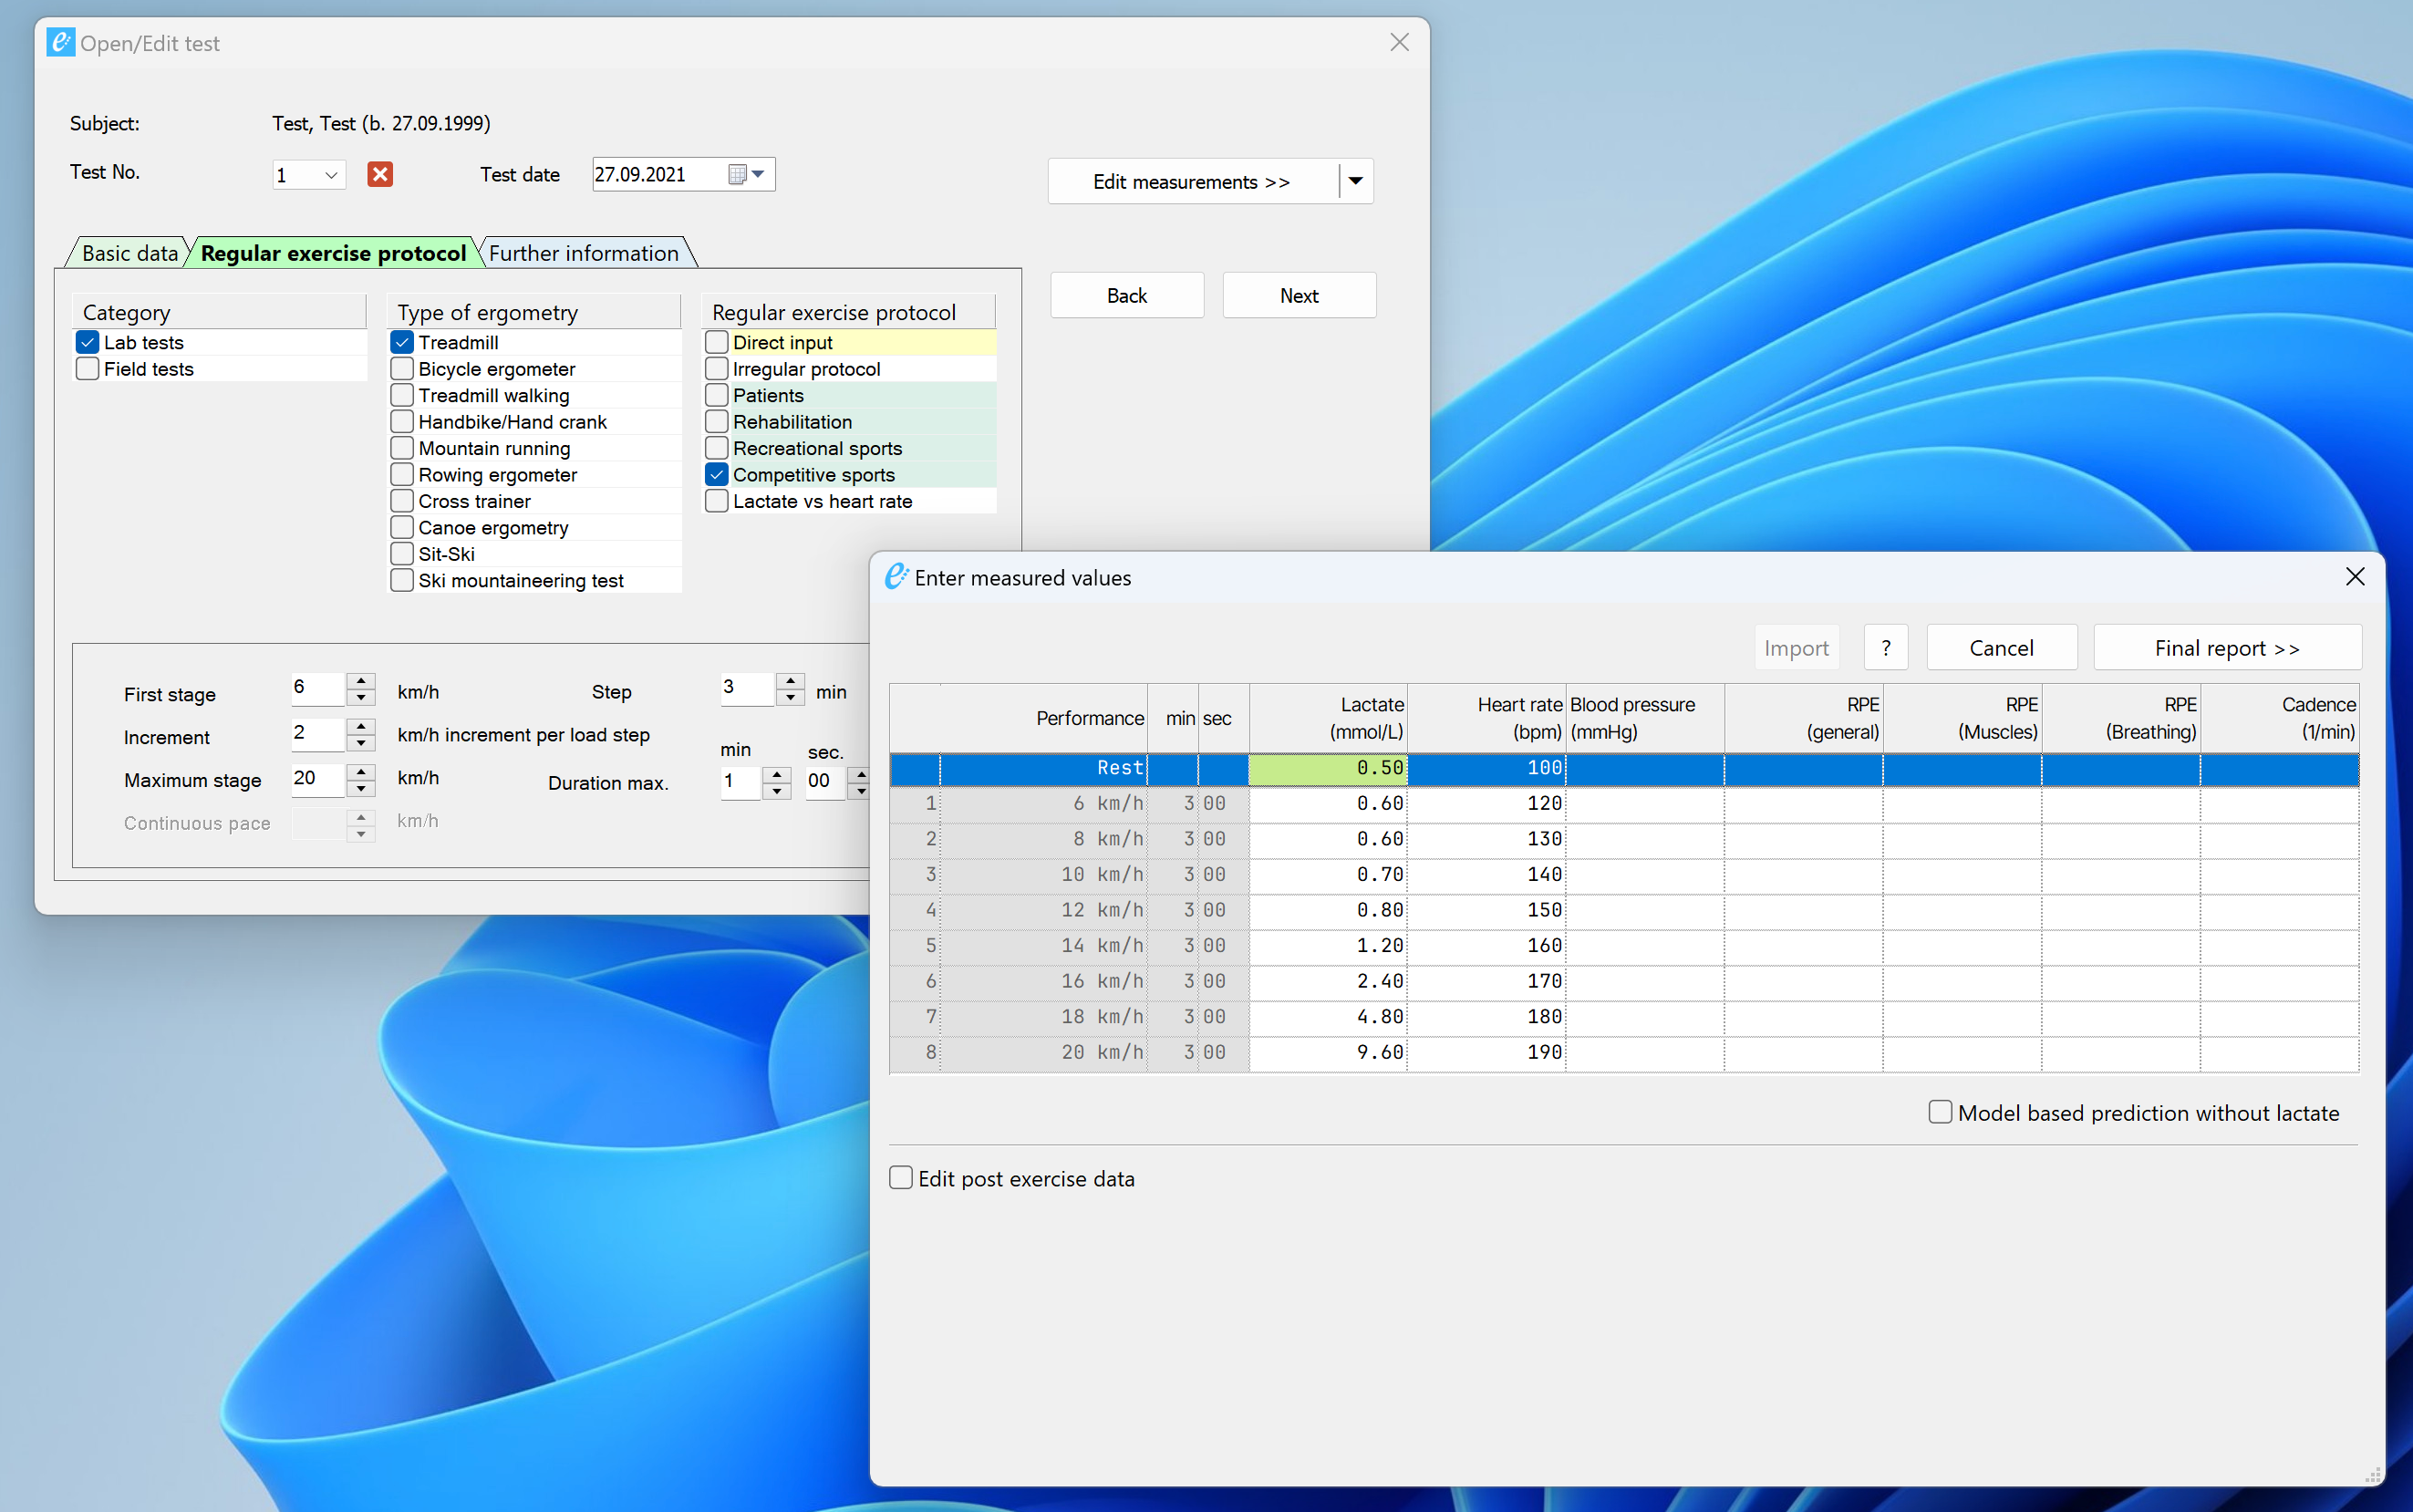
Redesigned measurement entry: a new tabbed entry dialog with a live mode for entering values step by step during a running test (automatic validation and row advancement). The stage values are now the fourth tab of the same dialog, tabs indicate their completion state by color, and clear action buttons replace the former drop-down.
Flexible group filtering: filter analyses by age range (dual-handle slider), gender, sport, discipline, ergometry type, and custom groups; selections are remembered between sessions.
Interactive charts: hover and pin individual data points in all charts, expand/collapse group plots, and zoom the analysis view from 50–300 %.
Background calculation engine: results for group analysis are computed in the background with a live progress bar in the status bar — the application stays fully responsive while calculations run.
Extended training zones: up to 8 training zones (previously 5) for cycling, running, and other sports, with new default names and abbreviations.
Context-aware units throughout the analysis views, including BPM, kcal, kJ, and MET; performance units now follow the ergometry type automatically.
Critical Power analysis for rowing: the CP module now supports rowing — with speed and distance calculations derived from power output and rowing-specific records in the CP curve display — and extends the same approach to roller skiing.
Automatic database backups: timestamped, rotating backups of the measurement database are created automatically, protected by database integrity checks.
Crash reports: if Ergonizer crashed or did not shut down properly, the next start offers to send an error report to Ergonizer Software (program version, Windows version, license identifier, type and location of the error, and a technical excerpt of the program state). Nothing is sent without your confirmation, and your database is never transmitted.
Automatic lactate outlier correction: a lactate value that deviates clearly from the course of the curve is detected from the curvature of the lactate curve, and Ergonizer asks whether to exclude it from the curve fit. Excluded values stay stored, are marked as outliers in the chart, and can be excluded or taken back at any time via right-click on the data point. The correction is switched on or off per test in the measured values dialog.
From the group chart straight to the test: right-click a test in any Group Analysis chart to open it as the active test in the lactate curve tab.
Training activities in the Critical Power view: import Garmin FIT files (several at once, or by drag-and-drop) and overlay them on the CP chart as mean-maximal power curves — the monotone envelope is always shown, the raw window maxima optionally as a dotted line, the fitted curve long-dashed. A new dialog lists all imported activities of the selected subject for overlay selection or deletion, duplicates are detected on import, and the x-axis mode of the chart can be switched from the toolbar.
Race predictions with training mileage: the marathon and roller-ski predictions now take weekly training mileage into account with a saturating model — mileage counts linearly up to 90 km per week and with diminishing returns beyond, so the predicted marathon speed never exceeds 103 % of the speed at the IAT.
Fresh installations start immediately: if no data directory is configured, Ergonizer creates an empty database on its own; an existing Version 5 data directory is offered for adoption.
License information at a glance: the splash screen and the About dialog show the licensee and, for time-limited licenses, the remaining days.
Direct data imports from other Ergonizer installations without exporting them beforehand
Bluetooth Low Energy connectivity for the Lactate Scout analyzer (in development).
Improvements
Ergonizer 6 is now a native 64-bit application, removing the memory limits of the 32-bit version for large databases and high-resolution printing.
Importing tests from another Ergonizer database (Version 5 or Version 6): the database type is detected automatically, a backup is created before the import, true duplicates are skipped, conflicting entries are shown for decision (individually or for the whole batch), and every imported test is verified and stamped with its import source and date.
Automatic migration of existing Version 5 databases: on first start, Ergonizer 6 detects an
ergonizer5.dbdata directory and converts it to the new format.Version 6 uses its own settings and database, so the beta can be installed and evaluated alongside your production Version 5 installation.
Smoother curve smoothing: dragging the smoothing slider no longer stalls the display; the recalculation runs once the slider comes to rest.
Group Analysis is noticeably faster with large databases (cached charts, faster percentile calculation, quicker redraws when zooming).
Group Analysis and the new charts are fully translated in all supported languages.
Modernized chart typography with the Inter font family and redesigned chart headers; zone labels in the lactate chart use Roboto Condensed and grid lines are drawn behind the zones.
New splash screen and modernized About dialog showing version, beta status, and license details.
Improved keyboard navigation in data-entry grids: arrow keys, Tab, and Enter move naturally between editable cells.
Clearer, non-blocking error messages during data export and long-running operations; corrected German special characters in messages and reports.
Improved display scaling on high-DPI monitors and better Windows 11 compatibility, including consistent tab colors and disabled icons.
Beta update channel: beta testers are offered beta updates automatically. The updater now checks program version, architecture, and channel before installing, refuses a mismatched updater, and shows its progress more smoothly.
Excel import is more robust: Ergonizer’s own export files are recognized by their column identifiers and validated against the current program version, so an outdated or edited file can no longer corrupt the database.
Group Analysis: the violin plot follows the selection immediately (the Update button is gone), the filter applies automatically, an empty selection shows a hint instead of an empty chart, and the performance profile shows quartile bands and quartile details on hover for large reference groups.
Lactate chart: the topmost training zone band now ends with a torn edge beyond the last measured stage instead of running into the time axis, and zone labels are placed more intelligently (full name between the curves, otherwise above or below, otherwise the abbreviation).
CP chart: the legend no longer covers the plot area, and hovering data points on logarithmic axes is more precise.
Trial version: the included reference data set can be explored in Group Analysis without counting against the trial limits (2 own subjects, 6 own tests).
Completed translations of the new dialogs, tooltips, and training-type names.
Support for additional licensed practices and institutions.
Extensive internal modernization (C++20, resource and memory management, deterministic shutdown) for long-term stability.
Bug fixes
Treadmill tests could be saved with a slope of 0 % because of a wrong validation rule; the slope is now checked correctly per test type.
Fixed a crash in the power output calculation when no test was active.
Weekly training mileage and training duration entered in the test dialog are now stored correctly and used immediately in the predictions.
Text fields are stored without padding characters, which could previously produce stray characters in exports.
The About dialog no longer clips the licensee text when it wraps onto several lines.
Fixed a possible deadlock when the splash screen closes.
Databases created before October 2022 could hold the blood gas values (\(p\mathrm{O}_{2}\), \(p\mathrm{CO}_{2}\), pH) and the oxygen saturation, glucose, and mask entries of a stage in swapped columns; affected stages are repaired automatically once at startup.
Fixed possible hangs when saving data while background calculations were running.
Fixed several crashes and memory issues related to chart rendering and window cleanup, including crashes caused by messages arriving for already closed windows.
Fixed crashes in curve fitting when a test contains too few data points.
Fixed an out-of-range error when a test had no training zones initialized.
Fixed duplicated or stale zone colors left over from earlier versions; they are repaired automatically on startup.
The test list no longer jumps to the top when switching groups in the Filter tab.
Fixed the CP curve print option and misaligned hover detection in the group chart.
Fixed first-click rendering and tab-activation issues in the new Group Analysis view.
Dmax and Dmax,mod can no longer be enabled at the same time; the checkboxes now react correctly.
Version 5.x – Stable
Version 5.16.6.303 – 2026-09-28
Improvements
More robust license-code validation: settings of one license can no longer carry over to another, and empty stored codes never match.
Support for additional licensed practices and institutions.
Internal modernization (C++20) for long-term stability.
Bug fixes
The automatic update check now measures the time since the last check correctly, also after the system clock has been set back.
Version 5.16.6.284 – 2026-09-03
Improvements
Training zones are now verified and, if necessary, initialized from the preferences before every evaluation, so a test with missing zone settings no longer produces an incomplete report.
More robust handling of logo and report bitmaps: invalid images are rejected instead of causing display errors.
Support for additional licensed practices and institutions.
Internal build and versioning improvements for more reliable releases.
Version 5.16.6.235 – 2026-07-17
New features
New cycling climb prediction: Unterriexingen–Markgröningen.
Improvements
PDF reports now embed complete fonts instead of subsets, improving rendering fidelity in external PDF viewers.
Improved selection and validation of the data directory at startup, with clear feedback when a folder does not exist or contains no database.
More consistent translations across settings panels and property grids.
Safer database transaction handling and more robust error reporting.
Updated Excel import/export components.
Support for additional licensed practices and institutions.
Bug fixes
Fixed a Unicode rendering issue in report text output.
Fixed initialization of date fields in the export dialog.
Version 5.16.6.133 – 2026-03-11
New features
New cycling climb prediction: Moritzberg (Nürnberg).
Improvements
More robust HL7 import: imported files are now always archived reliably, including safe handling of name collisions.
Improved stability of printing and chart rendering through extensive resource-management fixes.
Modernized internal grid components and safer background-thread handling.
Support for additional licensed practices and institutions.
Bug fixes
Fixed several memory leaks and potential crashes in chart and print workflows.
Fixed parsing of IP addresses in device communication settings.
Version 5.16.6.105 – 2026-02-23
New features
New cycling climb predictions on Mallorca: Sóller, Sa Calobra, Puig Major, and Randa.
Improvements
Blank training start dates are now handled consistently.
Improved Unicode support in address and report data.
Updated third-party components (charting and UI libraries).
Support for additional licensed practices and institutions.
Version 5.16.6.59 – 2026-01-02
New features
Added Hyrox as a newly supported sport discipline.
Introduced a new evaluation algorithm for roller skiing (Skiroller), enabling sport-specific performance analysis beyond existing models.
Improvements
Improved overall robustness and maintainability through targeted refactoring.
Refined demo mode handling to improve runtime reliability.
Minor structural cleanups to support future updates.
Bug fixes
Fixed potential null pointer issues in calculation logic.
Improved stability in configuration- and startup-related edge cases.
Version 5.16.6.52 – 2026-01-20
New features
Extended validation logic to support newly introduced evaluation algorithms.
Improvements
Improved HL7 data import handling and post-import cleanup.
Enhanced data merging logic to reduce inconsistencies during imports.
General stability improvements in core processing paths.
Bug fixes
Fixed edge cases in HL7 import and file deletion handling.
Improved robustness when merging existing records.
Version 5.16.6.15 – 2026-01-10
New features
Introduction of additional sport disciplines.
Introduction of new and extended evaluation algorithms for sport-specific performance analysis.
Improvements
Improved UI scaling behavior across different display configurations.
Refined PDF link handling for more reliable document access.
Cleaned up configuration and version handling.
Ongoing refactoring to improve code readability, const-correctness, and maintainability.
Improved printing, rendering, and font handling.
Updated third-party components and project configuration.
Bug fixes
Fixed minor UI scaling inconsistencies.
Resolved edge cases in PDF link generation.
Fixed various stability issues in printing and rendering workflows.
Resolved edge cases related to font loading and resource handling.
Improved robustness in calculation and slope handling logic.
Version 5.16.5.53 – 2025-01-22
Bug fixes
Fixed a bug that interchanged training mileage and training hours for new subjects
New features
GDT identification data imports (on personal request)
Optimizations
Improvements in UI and memory management
Version 5.16.5.16 – 2024-11-14 (critical)
Bug fixes
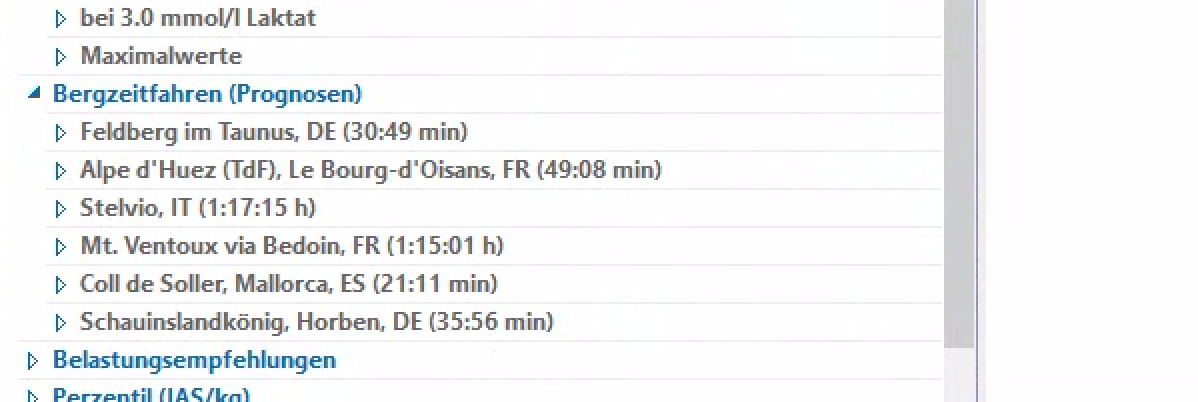
The cycling prediction machine accidentally was calibrated wrong in some of the last versions. The function for the prognosis of STRAVA segments now is working perfectly again.
Version 5.16.4.16 – 2024-09-27
Bug fixes
Fixed an issue where the software would sometimes crash during the analysis of hill running exercises
Resolved a bug that prevented PDF documents from being sent via email in certain scenarios
Corrected a problem with user interface elements not displaying properly on high-resolution screens.
Fixed a bug that impaired memory management during PDF creation and printing (“Out of memory”)
Version 5.16.3.356 – 2024-03-09
New features
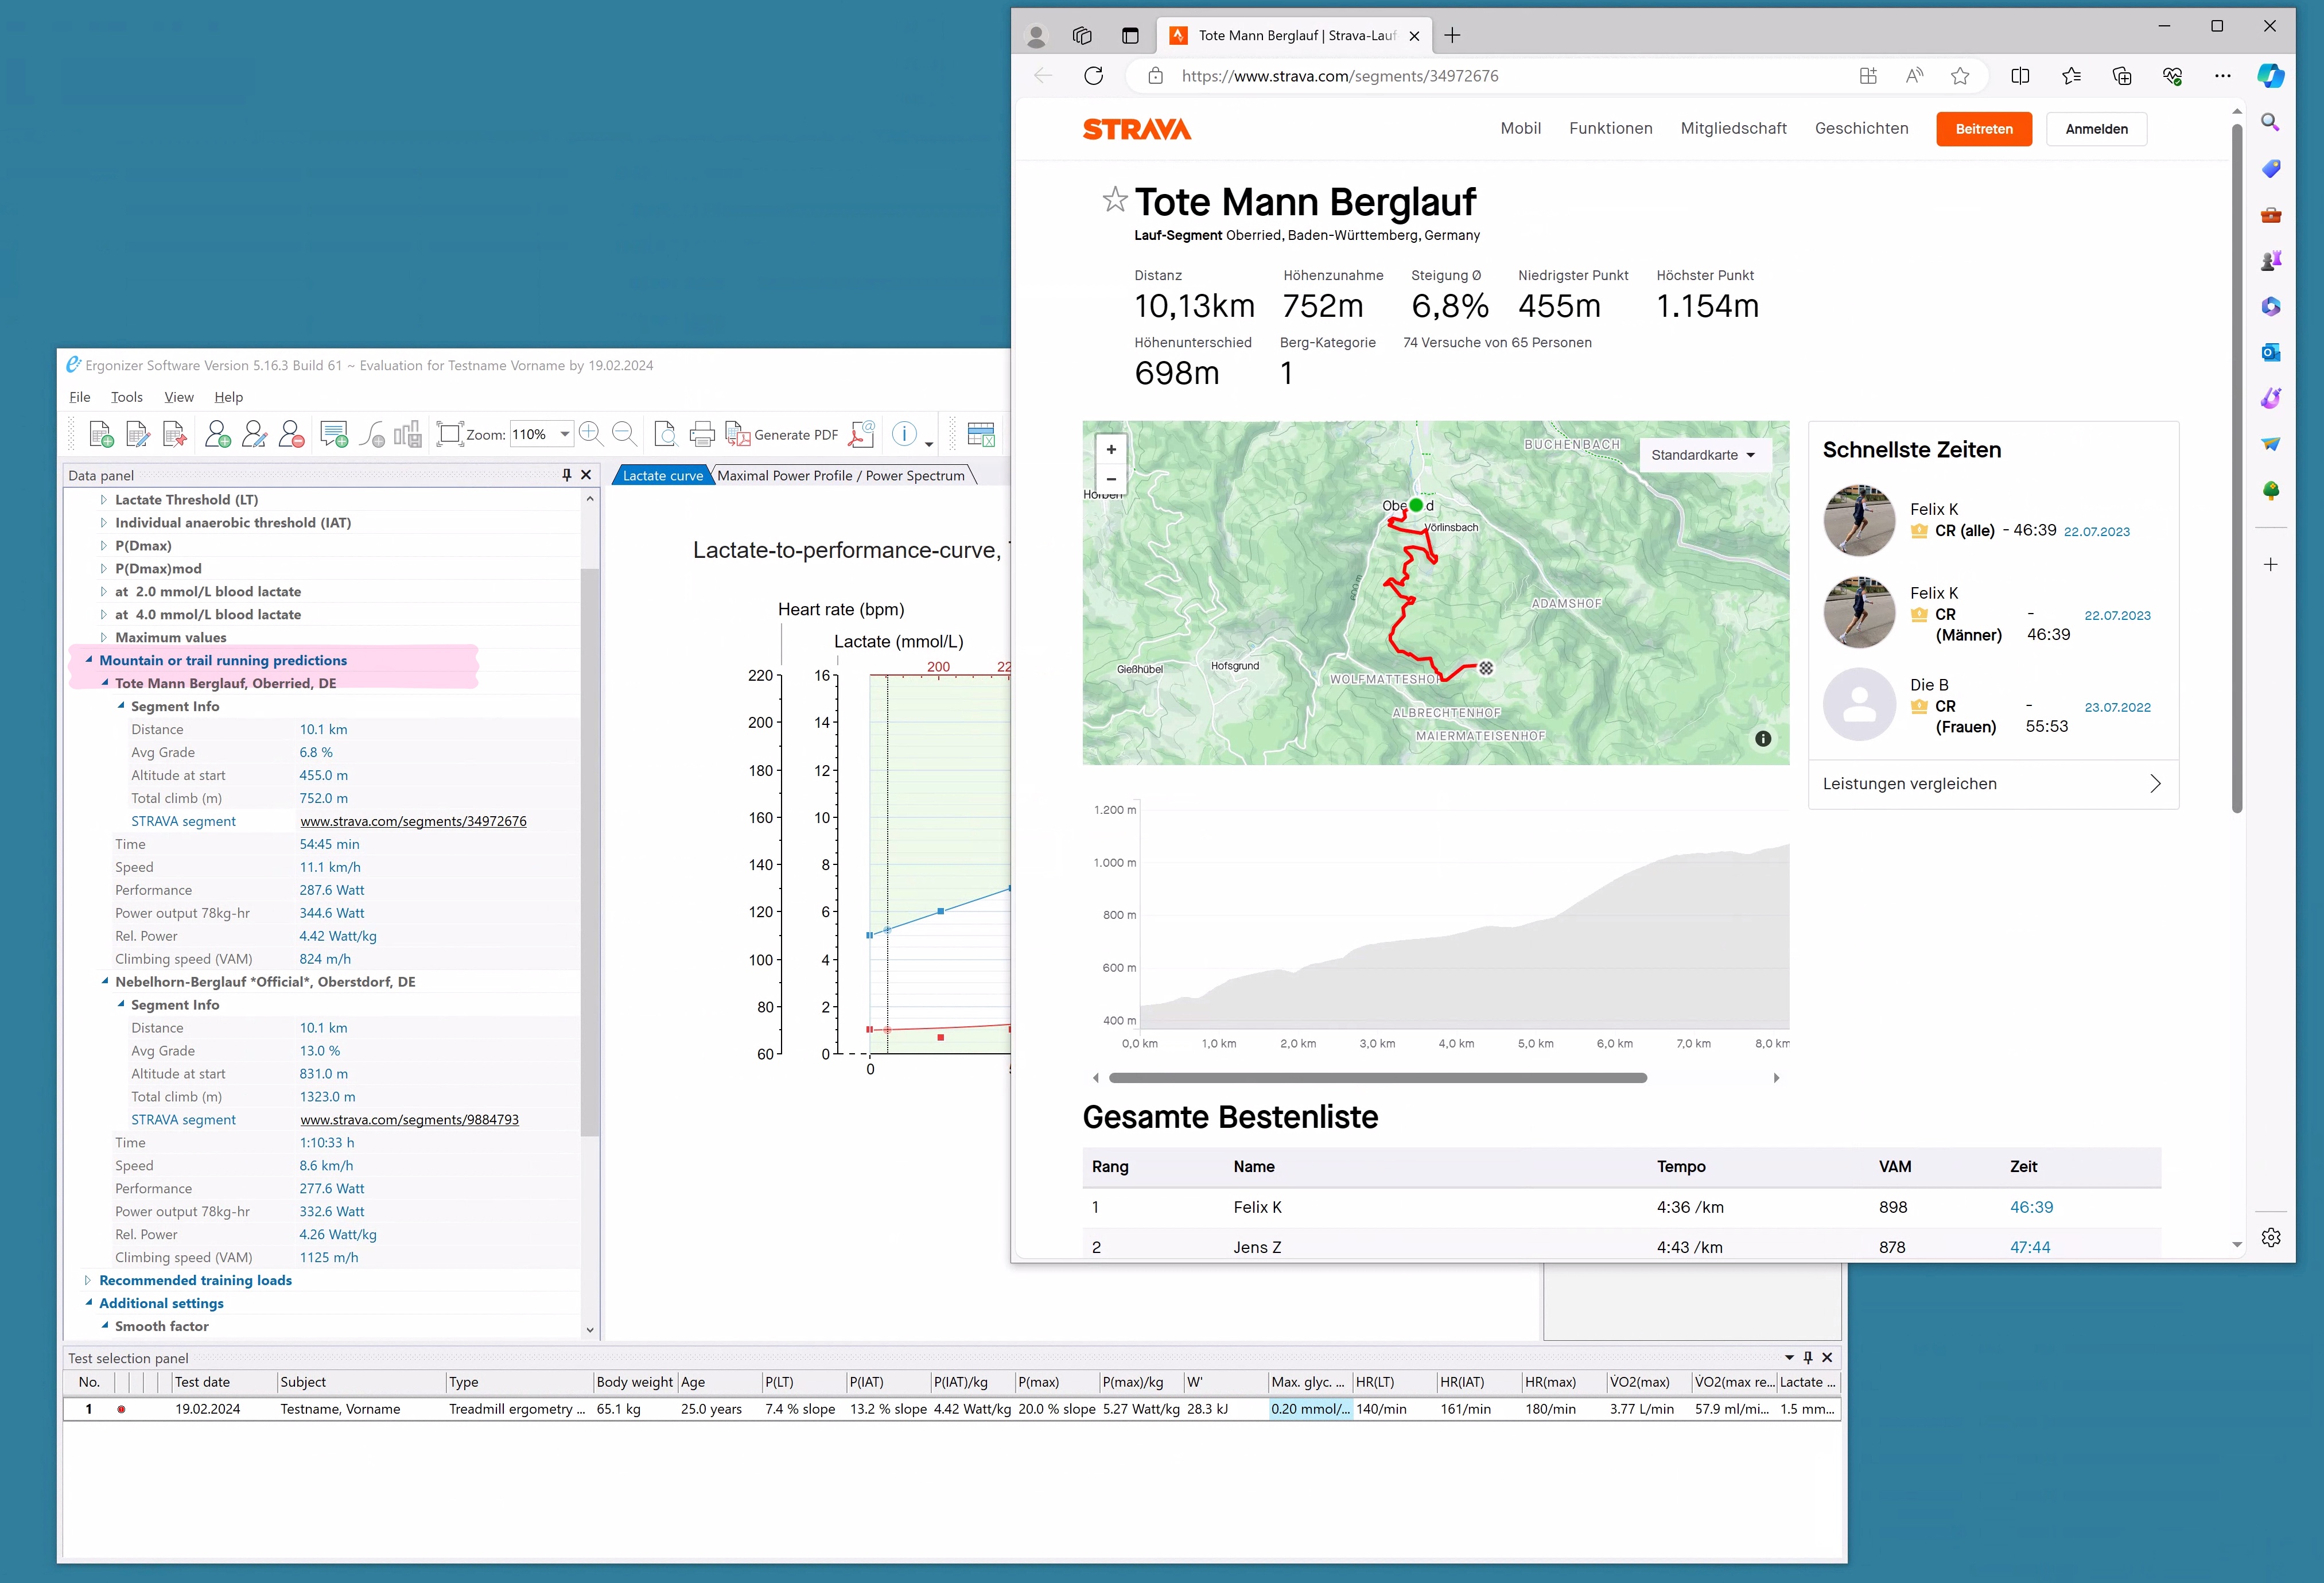
On the way to version 6, we decided to include one new feature in version 5 already – from hill running exercise testing the software now predicts certain STRAVA segments of steep hills.
The option to send PDF documents by mail is optimized now and works with SMPT directly. A text template can be edited with simple HTML codes.
Bug fixes
The hill running protocol is saved and processed more stable now.
A condition that leads to crashes after preview and printing any reports is fixed now. The applications runs much more stable now.
Fixed a bug that caused crashes in evaluations without lactate.
Optimizations
Conversions between flat running speeds and hill running (treadmill with slope incline) has been improved remarkably.
Selection of tests or subjects is more intuitive now.
Version 5.16.2.5 – 2023-11-07
New features
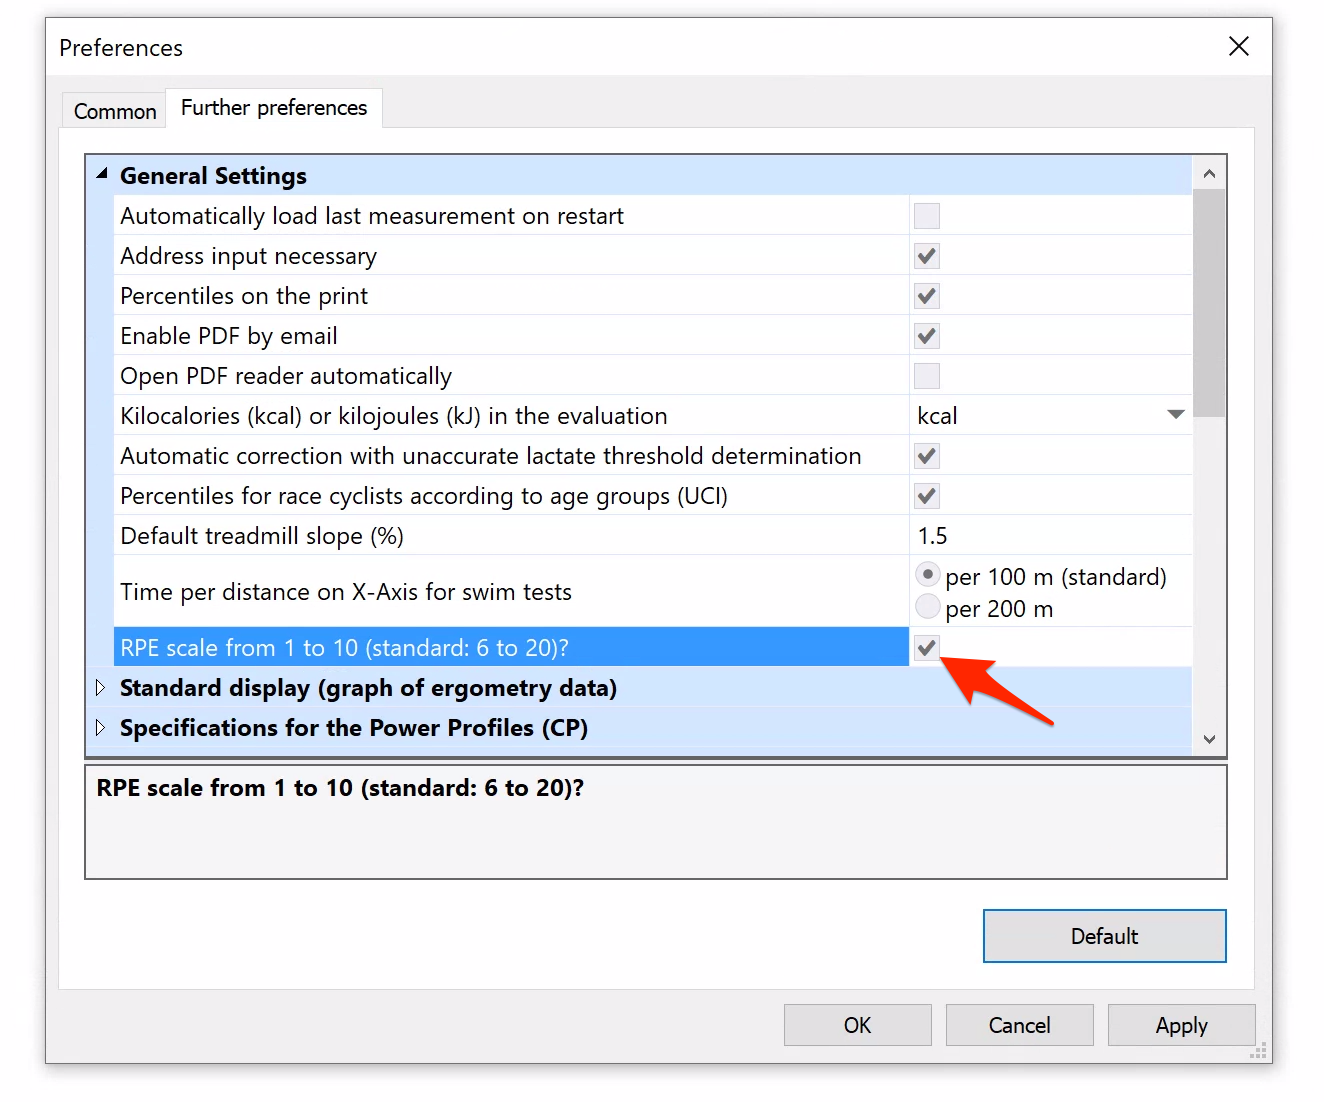
You can now directly switch the scale for RPE between 6 - 20 and 1 - 10. All previous data are converted directly and are displayed in the set scale.
Bug fixes
Catched a bug that prevents from calculating a proper power profile with flat lactate curves in running
W’ is now shown correctly in the comparison table on page two of the reports
Adapted the countries list to Unicode char sets
The thresholds are drawn correctly again in the graph without lactate measurement and AI-driven predictions.
Optimizations
Huge databases now load much faster
Version 5.15.5.135 – 2023-06-09
New features
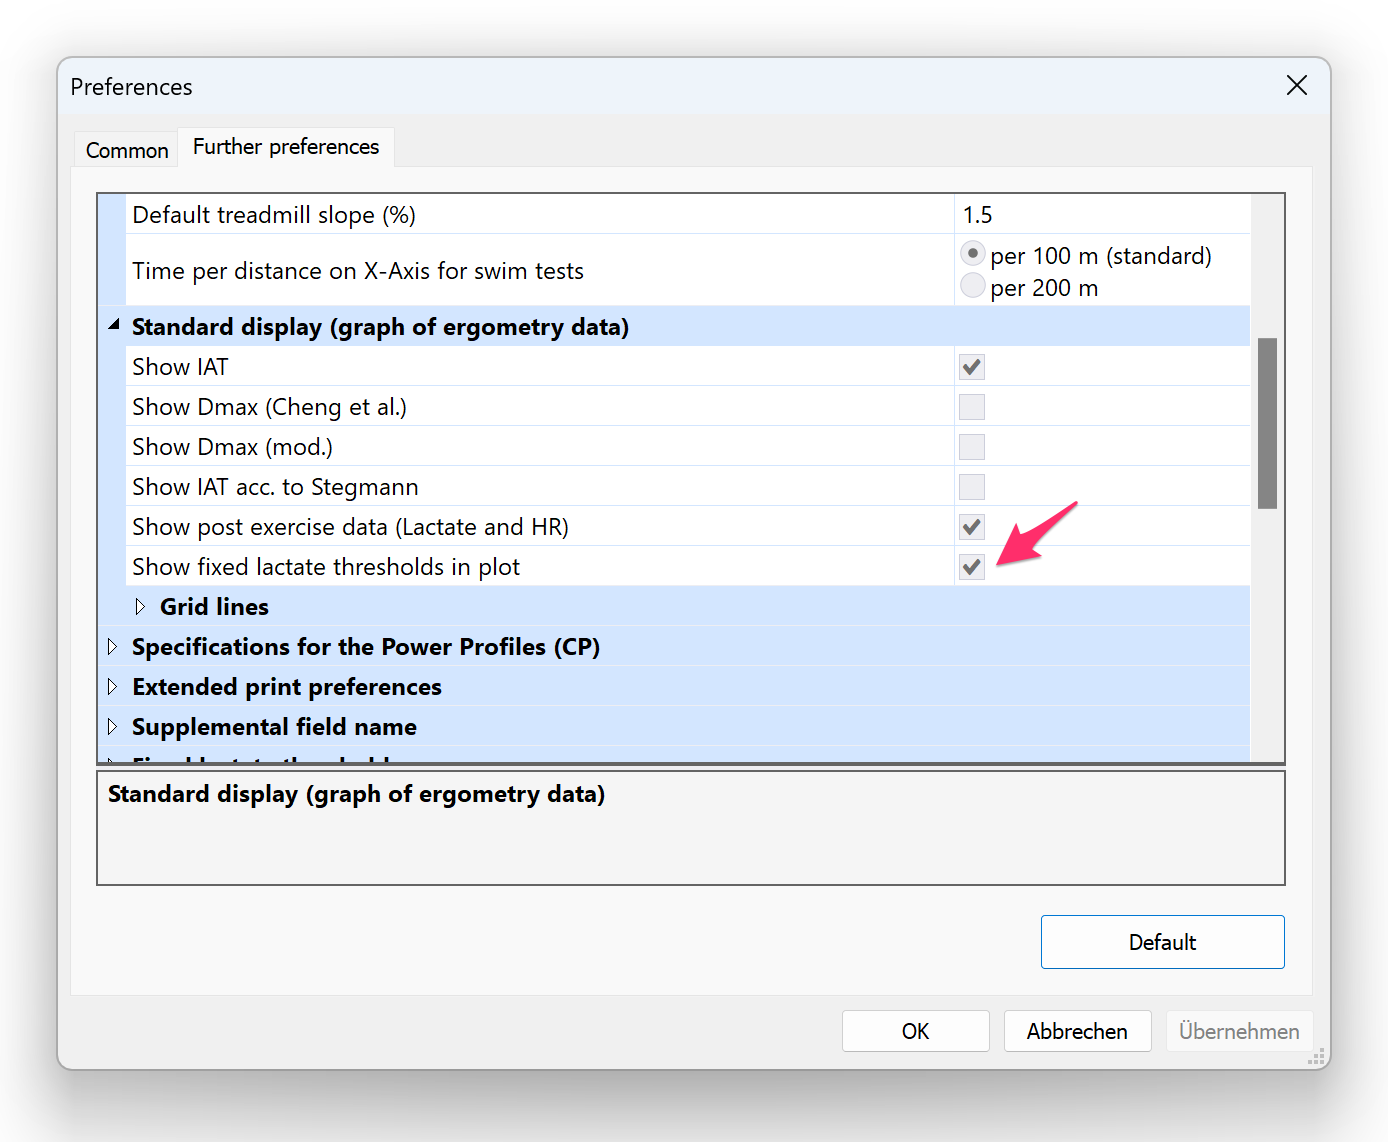
Fixed lactate “thresholds” can be set on the main plot generally – if one want it
Bug fixes
Fixed a bug that prevented the calculation of the duration of the last load step in some cases.
Fixed a crash if set and subsequently unset the check for prognosis without lactate
The comparison table now shows all the data from the preliminary examination correctly again
The EV code signing certification was renewed
Optimizations
X-axis labeling has been optimized for certain constellations with small increments
Version 5.15.4.33 – 2022-10-25
Optimizations
Improved analysis and curve fittings with specific situations including very short last exercise step duration
Improved calculation of \(\dot{V}\mathrm{La}_{\mathrm{max}}\) under certain conditions
Updated the PDF engine
Many speedups
Improvements of the xlsx-export routines
Improvements in the windows registry reliability
New version of the FitSDK implemented
Bug fixes
Corrected encodings for some countries
Corrected the icons in the history panel
Version 5.15.1.85 – 2022-08-31
New features
New handling for the situation without database (initiation)
Optimizations
Updated the database structure for stability and speed
Corrected some toolbar icons (gray if not active)
Better access management to the database on net drives
Startup speed increased
Excel export improvements
Bug fixes
Names can be modified now without SQL warning
The button to applicate MMPs from the CP curve is disabled now if distance is zero
Fixed an error that caused date fields not to be exported with certain format presets
Version 5.14.2.11 – 2022-02-20
New features
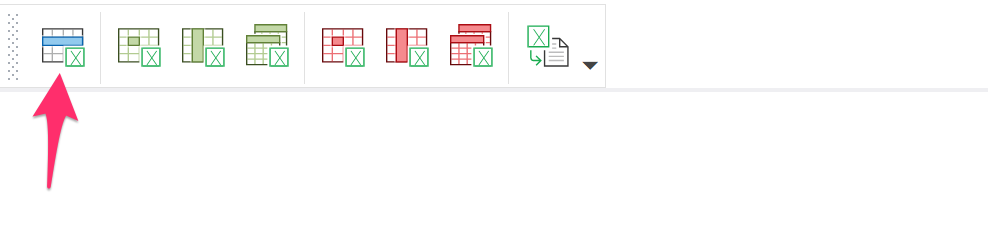
You can now directly export the data of the already selected test person and no longer need to detour via the selection menu.
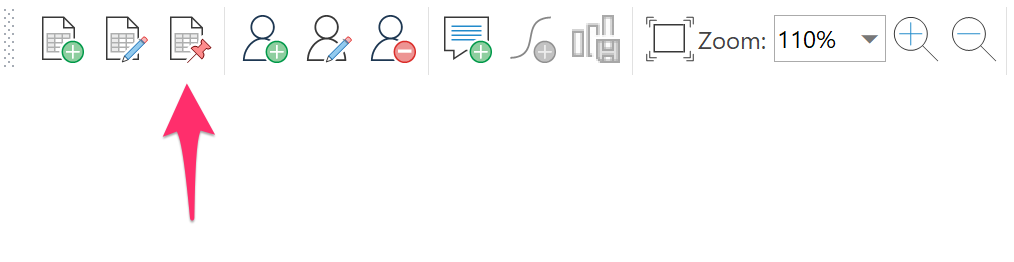
New button to edit the active dataset directly without going through the selection process:
Optimizations
Prediction for STRAVA-segment 15397319 had to be corrected (sorry, less altitude gain … )
Export files now includes information about the software version for debugging reasons
Ergonizer runs surprisingly well on a new M1-MacBook in a Parallels virtual machine with Windows 11 (ARM) - see screenshot. A little tweak that prevented from changing the application language was corrected in the meanwhile:
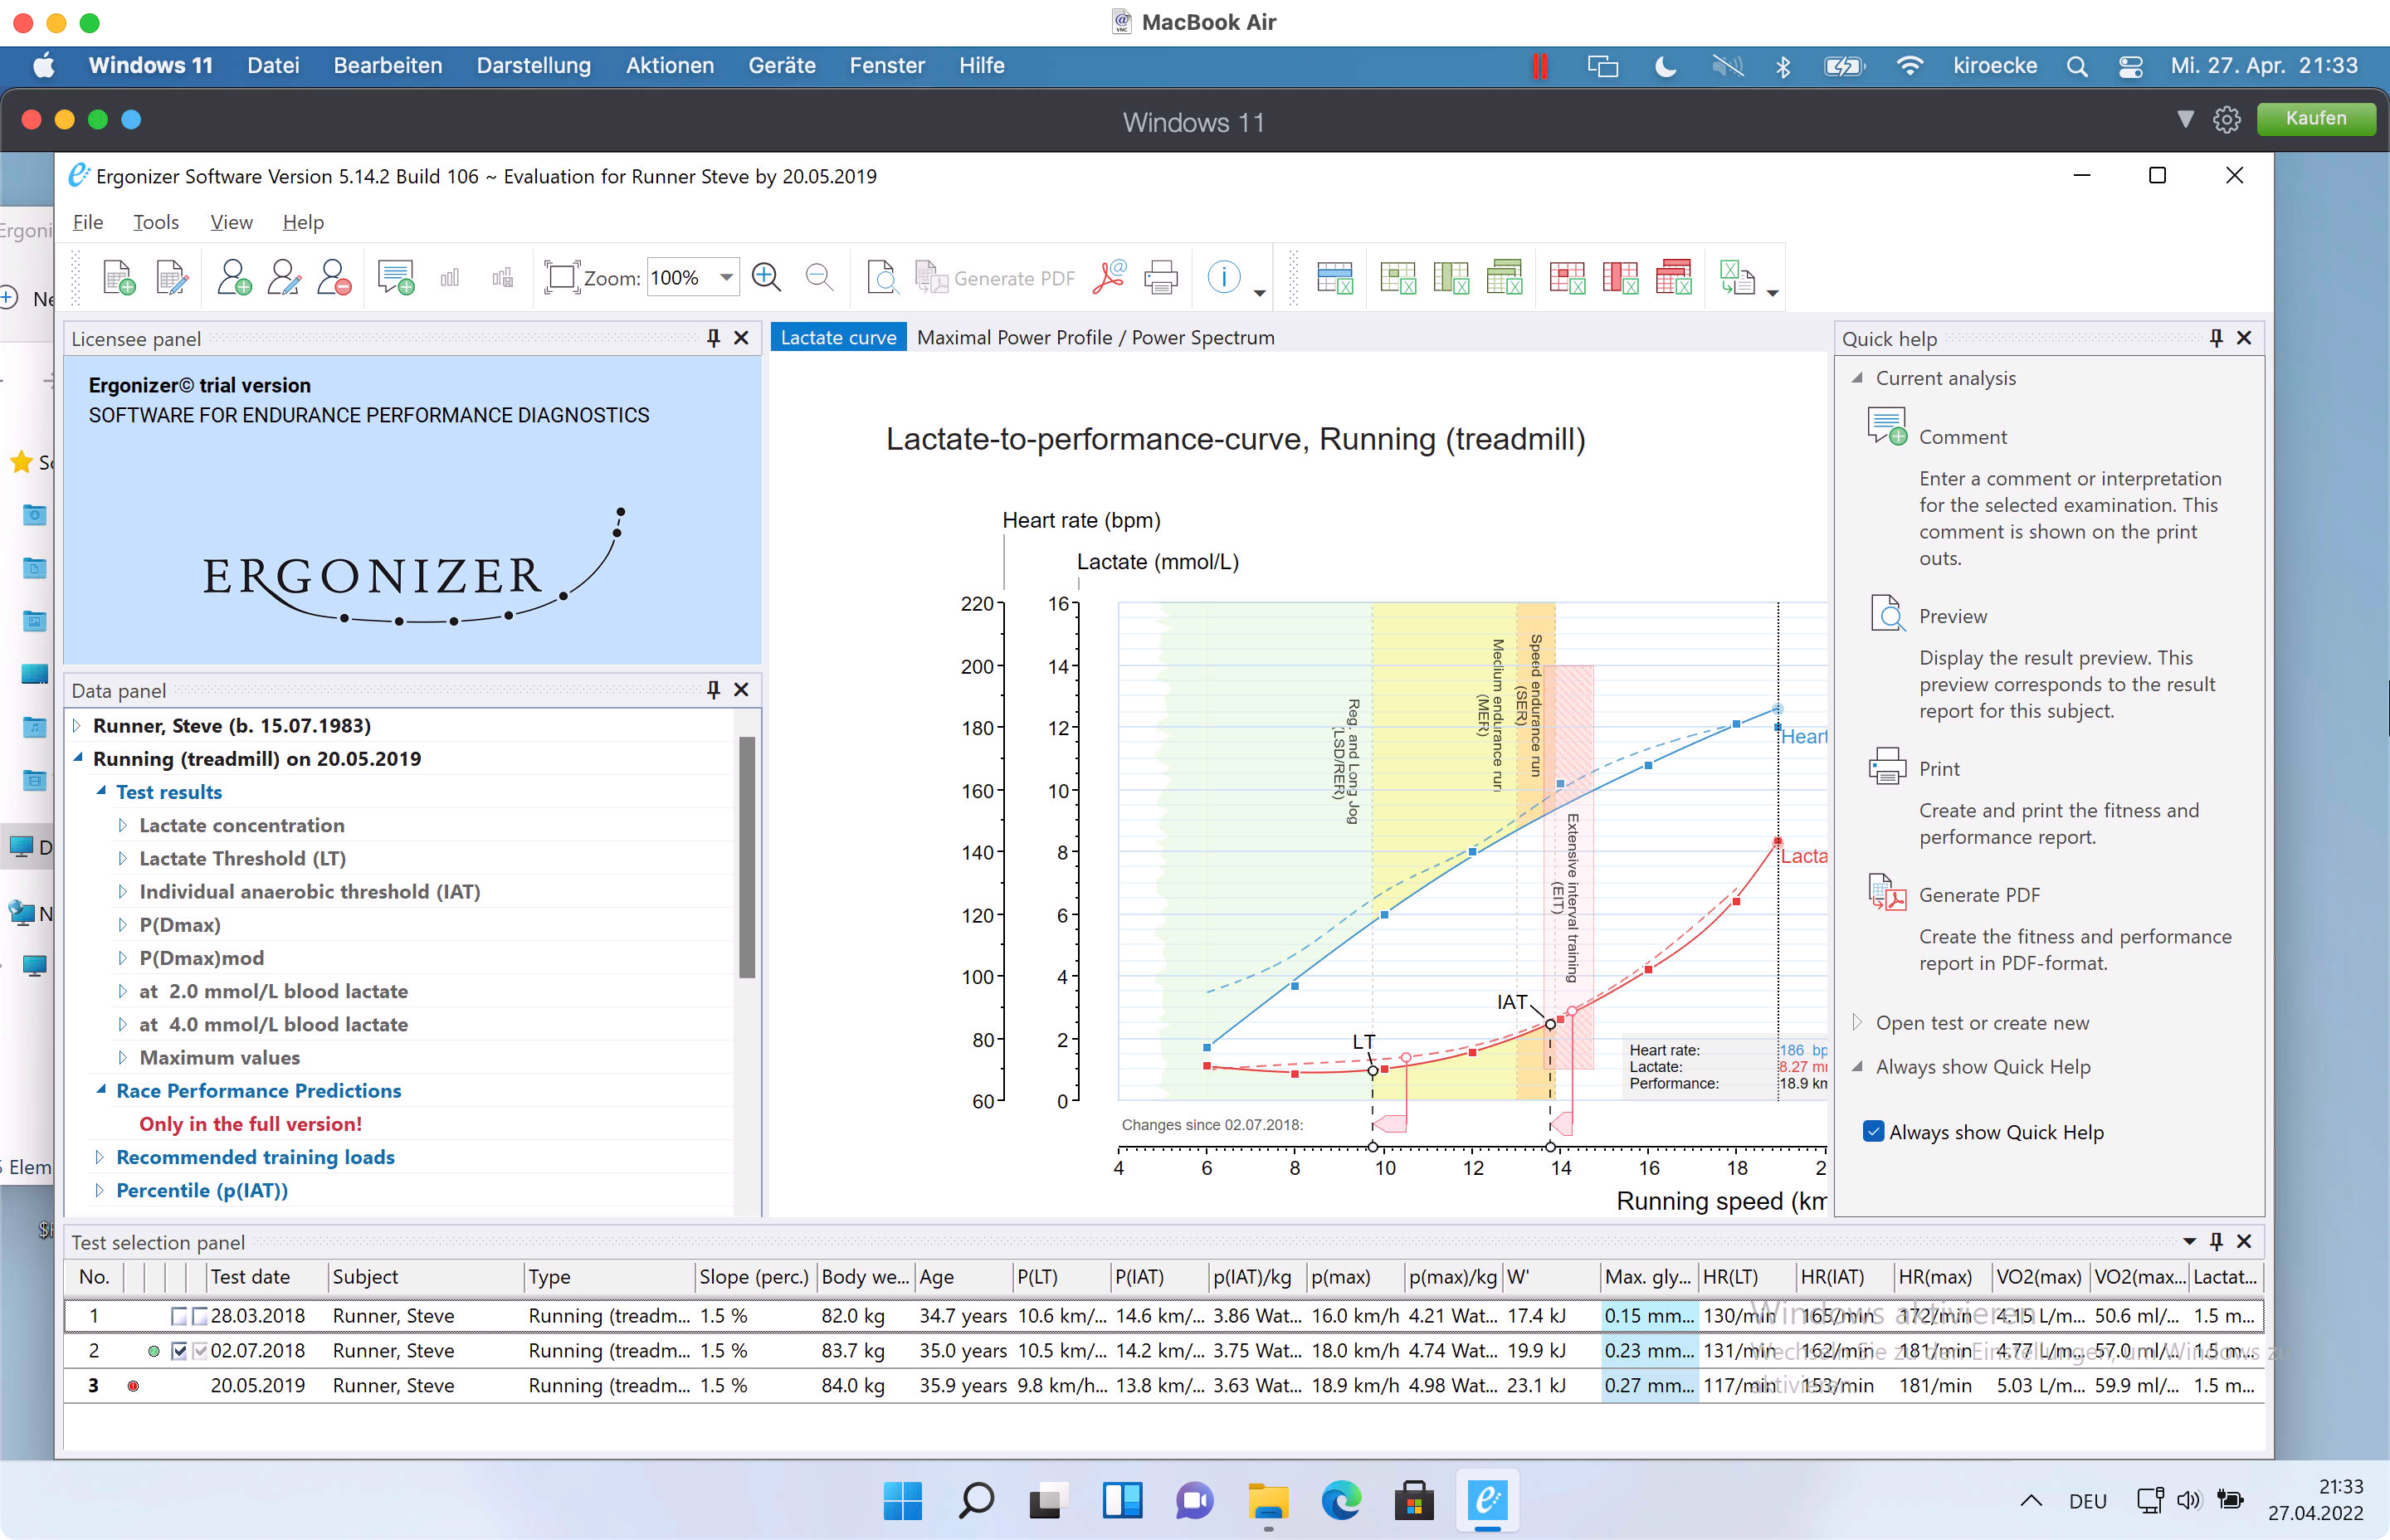
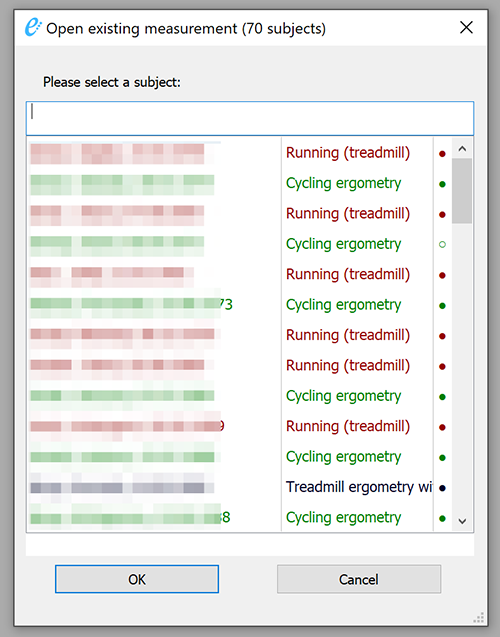
More information with selection of existing tests from the database. The little dots show if at test was done with lactate (filled) or not (hollow):
Bug fixes
Fixed icons in the toolbar for standard displays (high resolution display looked already fine)
Corrected the display of icons in the hint panel on non-high-resoluted displays
Incorrect calculations of the speed in m/s after changing the lactate constant were corrected
Running speed for the first load step was displayed wrong under certain circumstances
Anonymized Excel exports from previously selected subjects did not work properly
Version 5.13.1.39 – 2021-11-16
New features
\(\dot{V}\mathrm{La}_{\mathrm{max}}\) now can be displayed on the first page of the reports
Optimizations
Fully vectorized icons
Optimization for high resolution displays
Improved the automatic update engine
New graphical engine
Many improvements for High-DPI monitors
Fixed some seldom cases of heap corruptions, improved stability of the software
Better calculation of STRAVA segment predictions
Bug fixes
Fixed an registry related bug that causes instant crashes in seldom cases
Some language corrections (French, English)
Fixed a table entry at the second page for the lactate threshold in some sports
Language switching works also for countries now
Fixed a crash that occurs by activating clipboard templates from the menu
Version 5.10.4 – 2021-06-04
New features
Export files from WinLactat (*.itf) can now be imported (with some technical limitations, e.g., the files don’t contain the gender of the tested persons – for better results these paramaters should be entered manually after importing)
Optimizations
Introduced Dpi-awareness for better scaling on high dpi computer monitors
The xlsx-export was overhauled
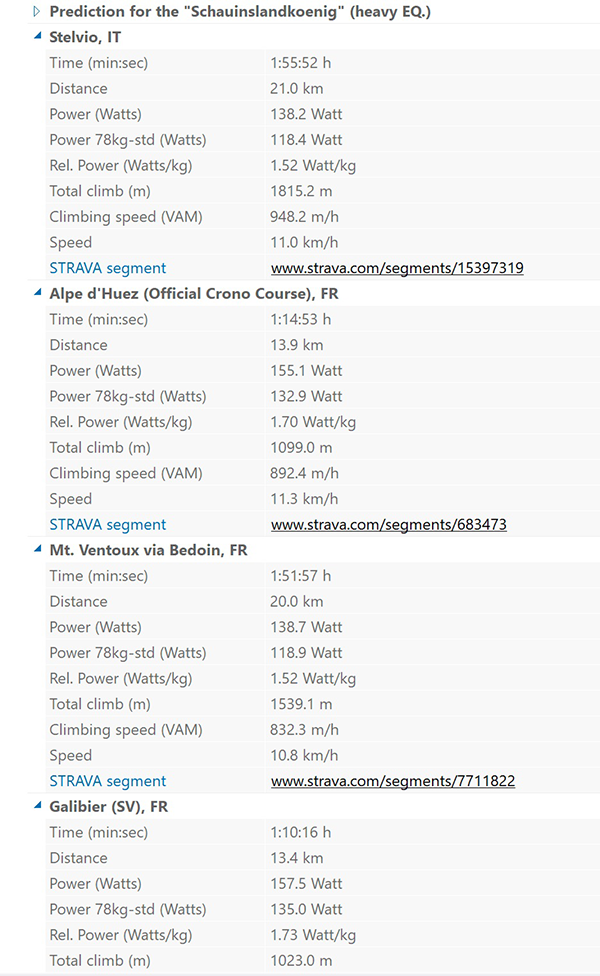
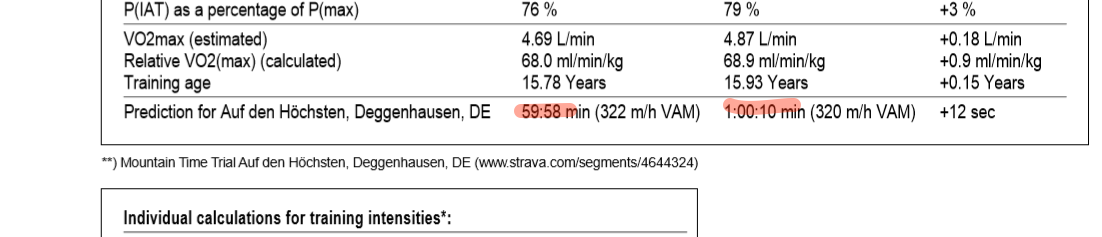
Improved the display of predictions for popular STRAVA segments for cycle mountain time trials from lab testing results:
Bug fixes
A nasty bug was corrected that considered only the first from multiple (or two) tests in the predictive calculations and the CP curves. Sometimes this yielded wrong prognoses if several tests were selected. Many thanks to Clemens Rumpl at St. Pölten, who discovered the bug!
Under certain conditions, saved comments did not show up after reload
Version 5.10.2 – 2021-03-17
New features
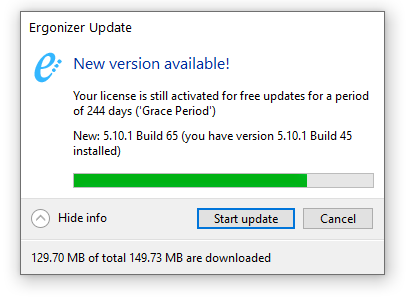
Added a fully integrated function for notification, download and installation of new software versions
Optimizations
Dramatically decreased loading times for selections from large databases
Bug fixes
Fixed a bug that caused a crash during exporting .xlsx data due to wrong sheet titles
Fixed a bug that caused errors in the STRAVA segment or running distance predictions if more than one test was conducted
Version 5.9.3 – 2021-01-22
New features
Crossfit was added to the sports categories
Postcodes for Luxembourg (LU) & Portugal (PT) are included now into the address checker (as already DE, AT, CH, NL, BE)
Easy way to activate a log file added
Optimizations
Several optimizations for speed and reliability
Standard printer page size is now resetting automatically for previewing the reports
Bitmap presentation on page 2 was optimized
Prediction for IAT without lactate measurement was further improved
The small report was optimized
The dialog for subjects information has been improved
Improved and modernized the updates checker
Bug fixes
Some rare errors associated with the generation of PDF documents have been corrected
Standard printer page size is now resetting automatically for previewing the reports
All country strings now are loaded correctly into UTF-8 (few misspellings had arisen)
Relative performance at LT will no presented correctly at the side panel
A rare bug with ‘mph’ as unit for running was corrected
W’ is calculated now more robustly
Correction for the training recommendation for running in the category “simple”
A nasty bug with errornous calculation of the LT (since 2 weeks) was fixed
Version 5.9.0 – 2020-10-28
New features
Complete redesign of the PDF-generator. It now works without a printer dialog and with temporary system printers, leaving your system untouched after PDF generation.
Optimizations
Several optimizations for speed and reliability
Version 5.8.2 – 2020-10-04
Optimizations
Language switching preserves the type of sports in the destination language now
The short version of the print report has been optimized
Bug fixes
Corrected some small bugs in the table output for treadmill analyses
Corrected some small bugs in the table outputs for cycling analyses
Fixed logo position on page two
Fixed some language related problems
Fixed a bug that throwed an error with the creation of a new subject identification
The new references for training recommendations with different fixed lactate concentrations are working now properly
Fixed a bug that prevented phone numbers from being imported properly from Excel documents
Fixed a critical bug that caused program shutdowns when switching between different subjects
Version 5.8.0 – 2020-07-10
New features
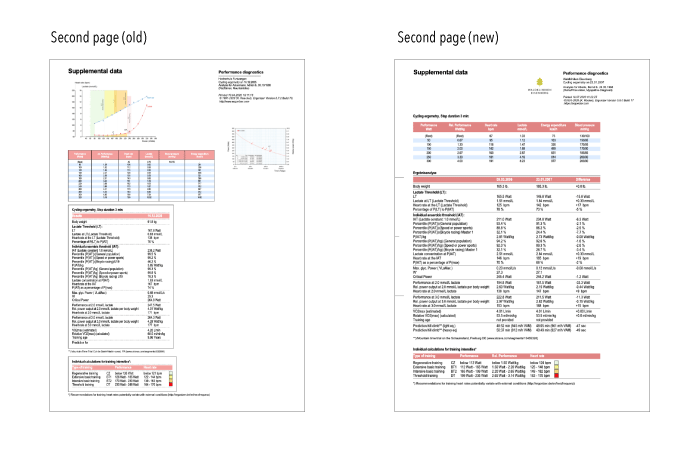
Complete revision of the table structure in the report pages with additional preparation for new graphical elements:
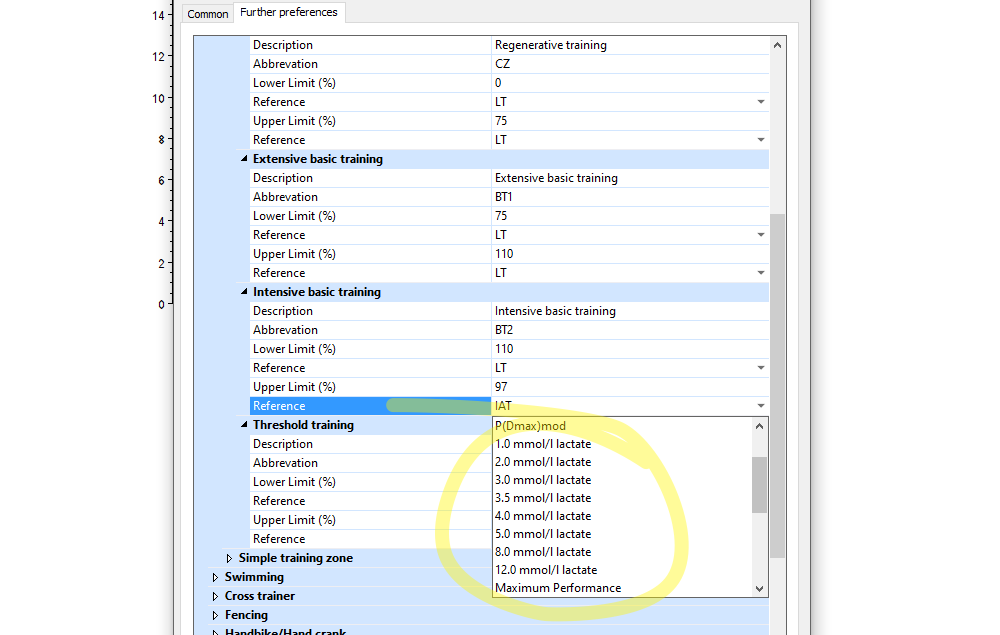
Added some specific constraints for the training zones with fixed lactate concentrations:
The Italian translation was completely reviewed and corrected. Un grazie di cuore a Nicola Cardaci di Torino, senza il quale questo progetto non avrebbe avuto successo.
Optimizations
Improved prediction of CP-20 (maximal power output for 20min) without lactate measurements
Prediction algorithms for lactate-less endurance diagnostics on the bicycle ergometer has been further improved
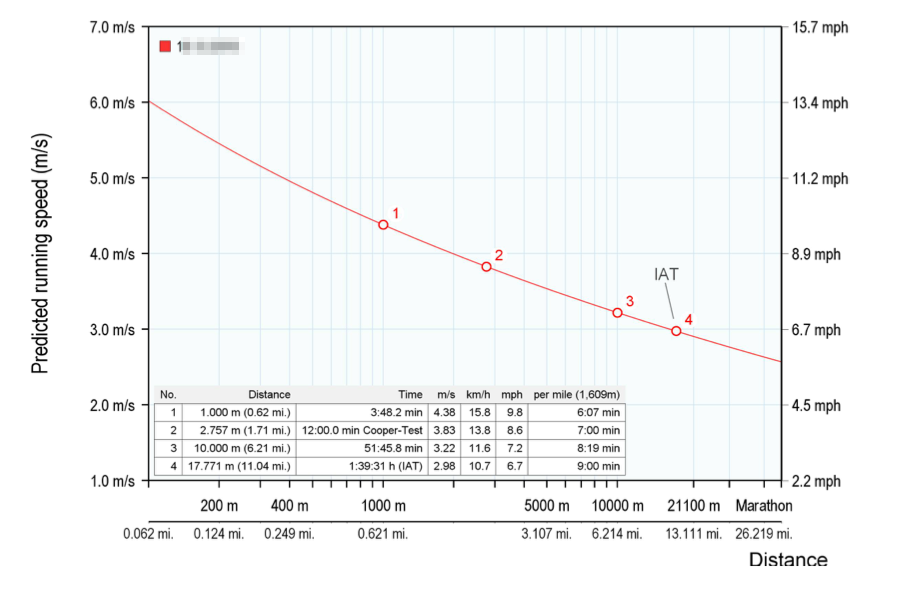
Improved the Power Profile Forecast in running if there is mph as speed unit
Bug fixes
Fixed a small bug that throw an error after exporting large samples
Fixed a bug that prevented swimming tests from being analyzed under some circumstances
Training intensities are now correctly calculated if the Stegman-threshold is selected
Fixed a bug with different results for rounding heart rate at several reference points
Version 5.7.1 – 2020-03-30
New features
Further improvements to the model based prediction of reference points for bicycle ergometer tests. Now managed with k-fold cross validation that improves fitting quality
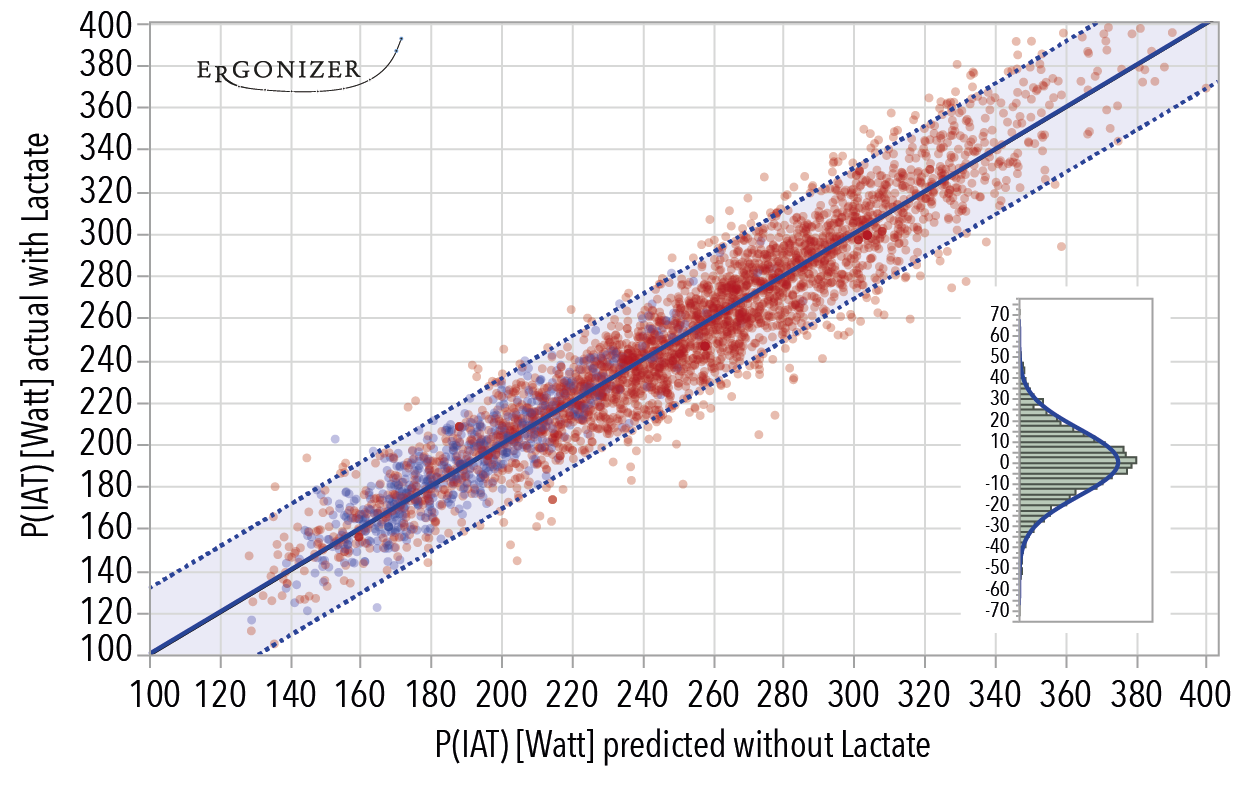
Modelling based calculation of FTP and CP20 also with multistage-tests without lactate
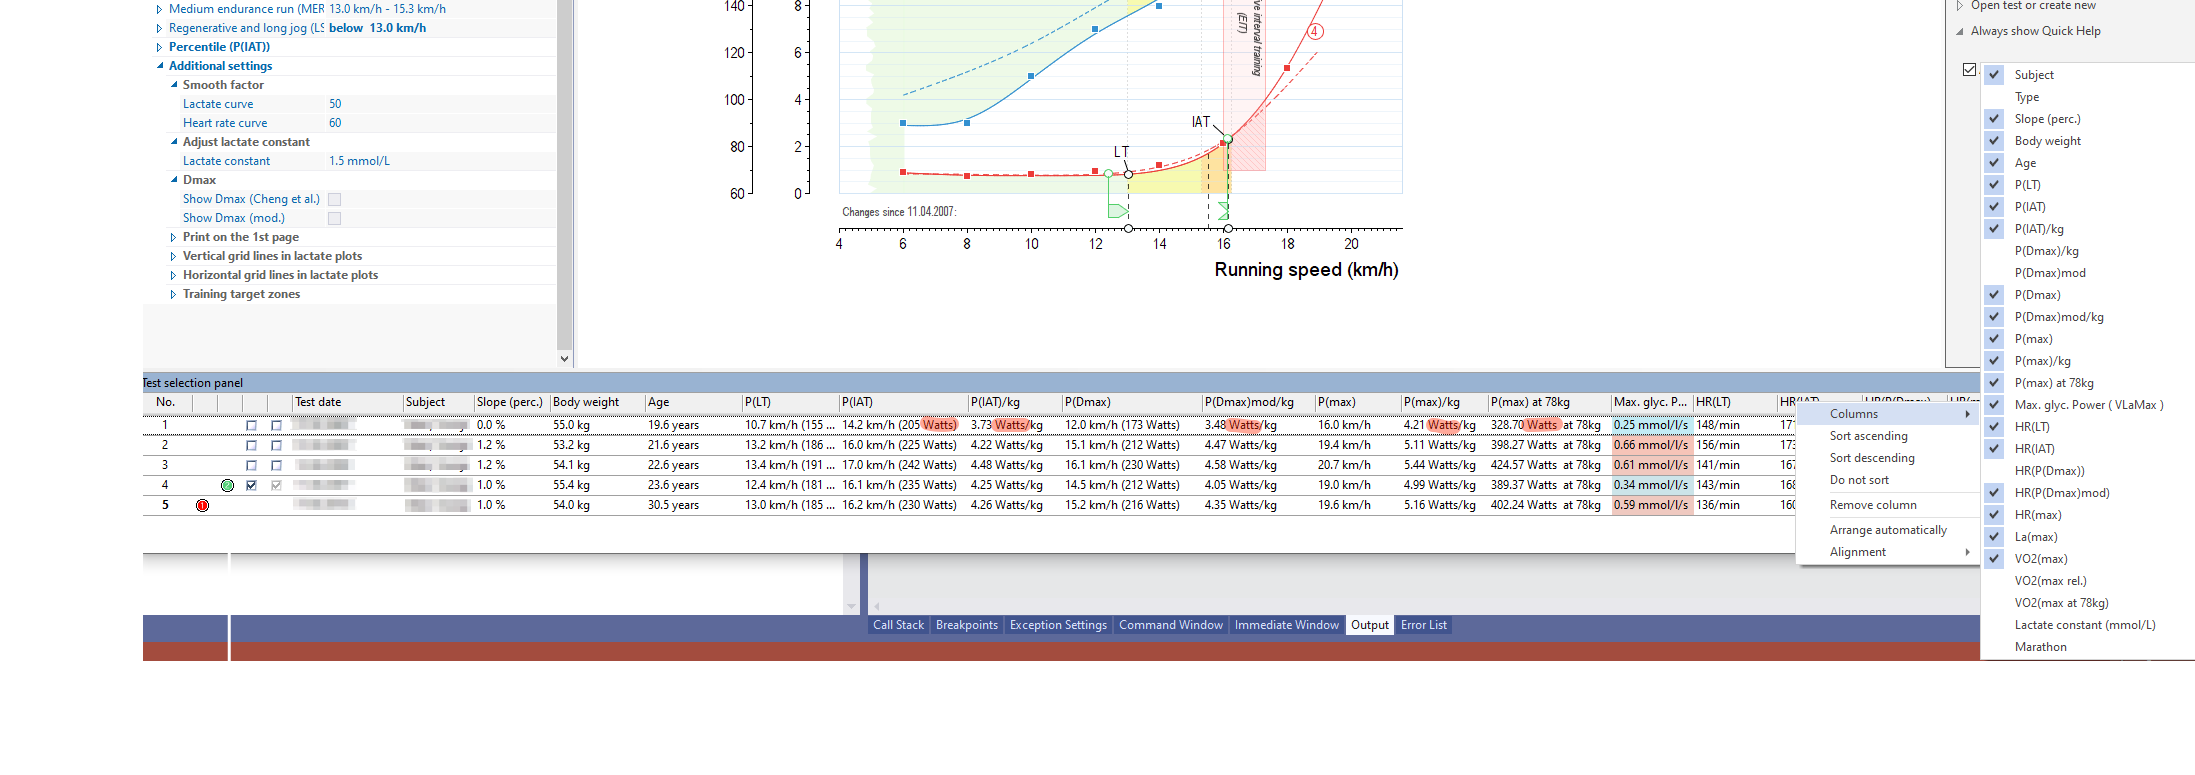
Right-click table header for the selection of additional spreadsheet-like data in the time course
W’ and CP are calculated now, derived from power-profile modeling
W’ and CP (« Critical Power’) are now included into all Excel-exports and the results history
W’ and CP are now added into the “extended” list on the second page of the report
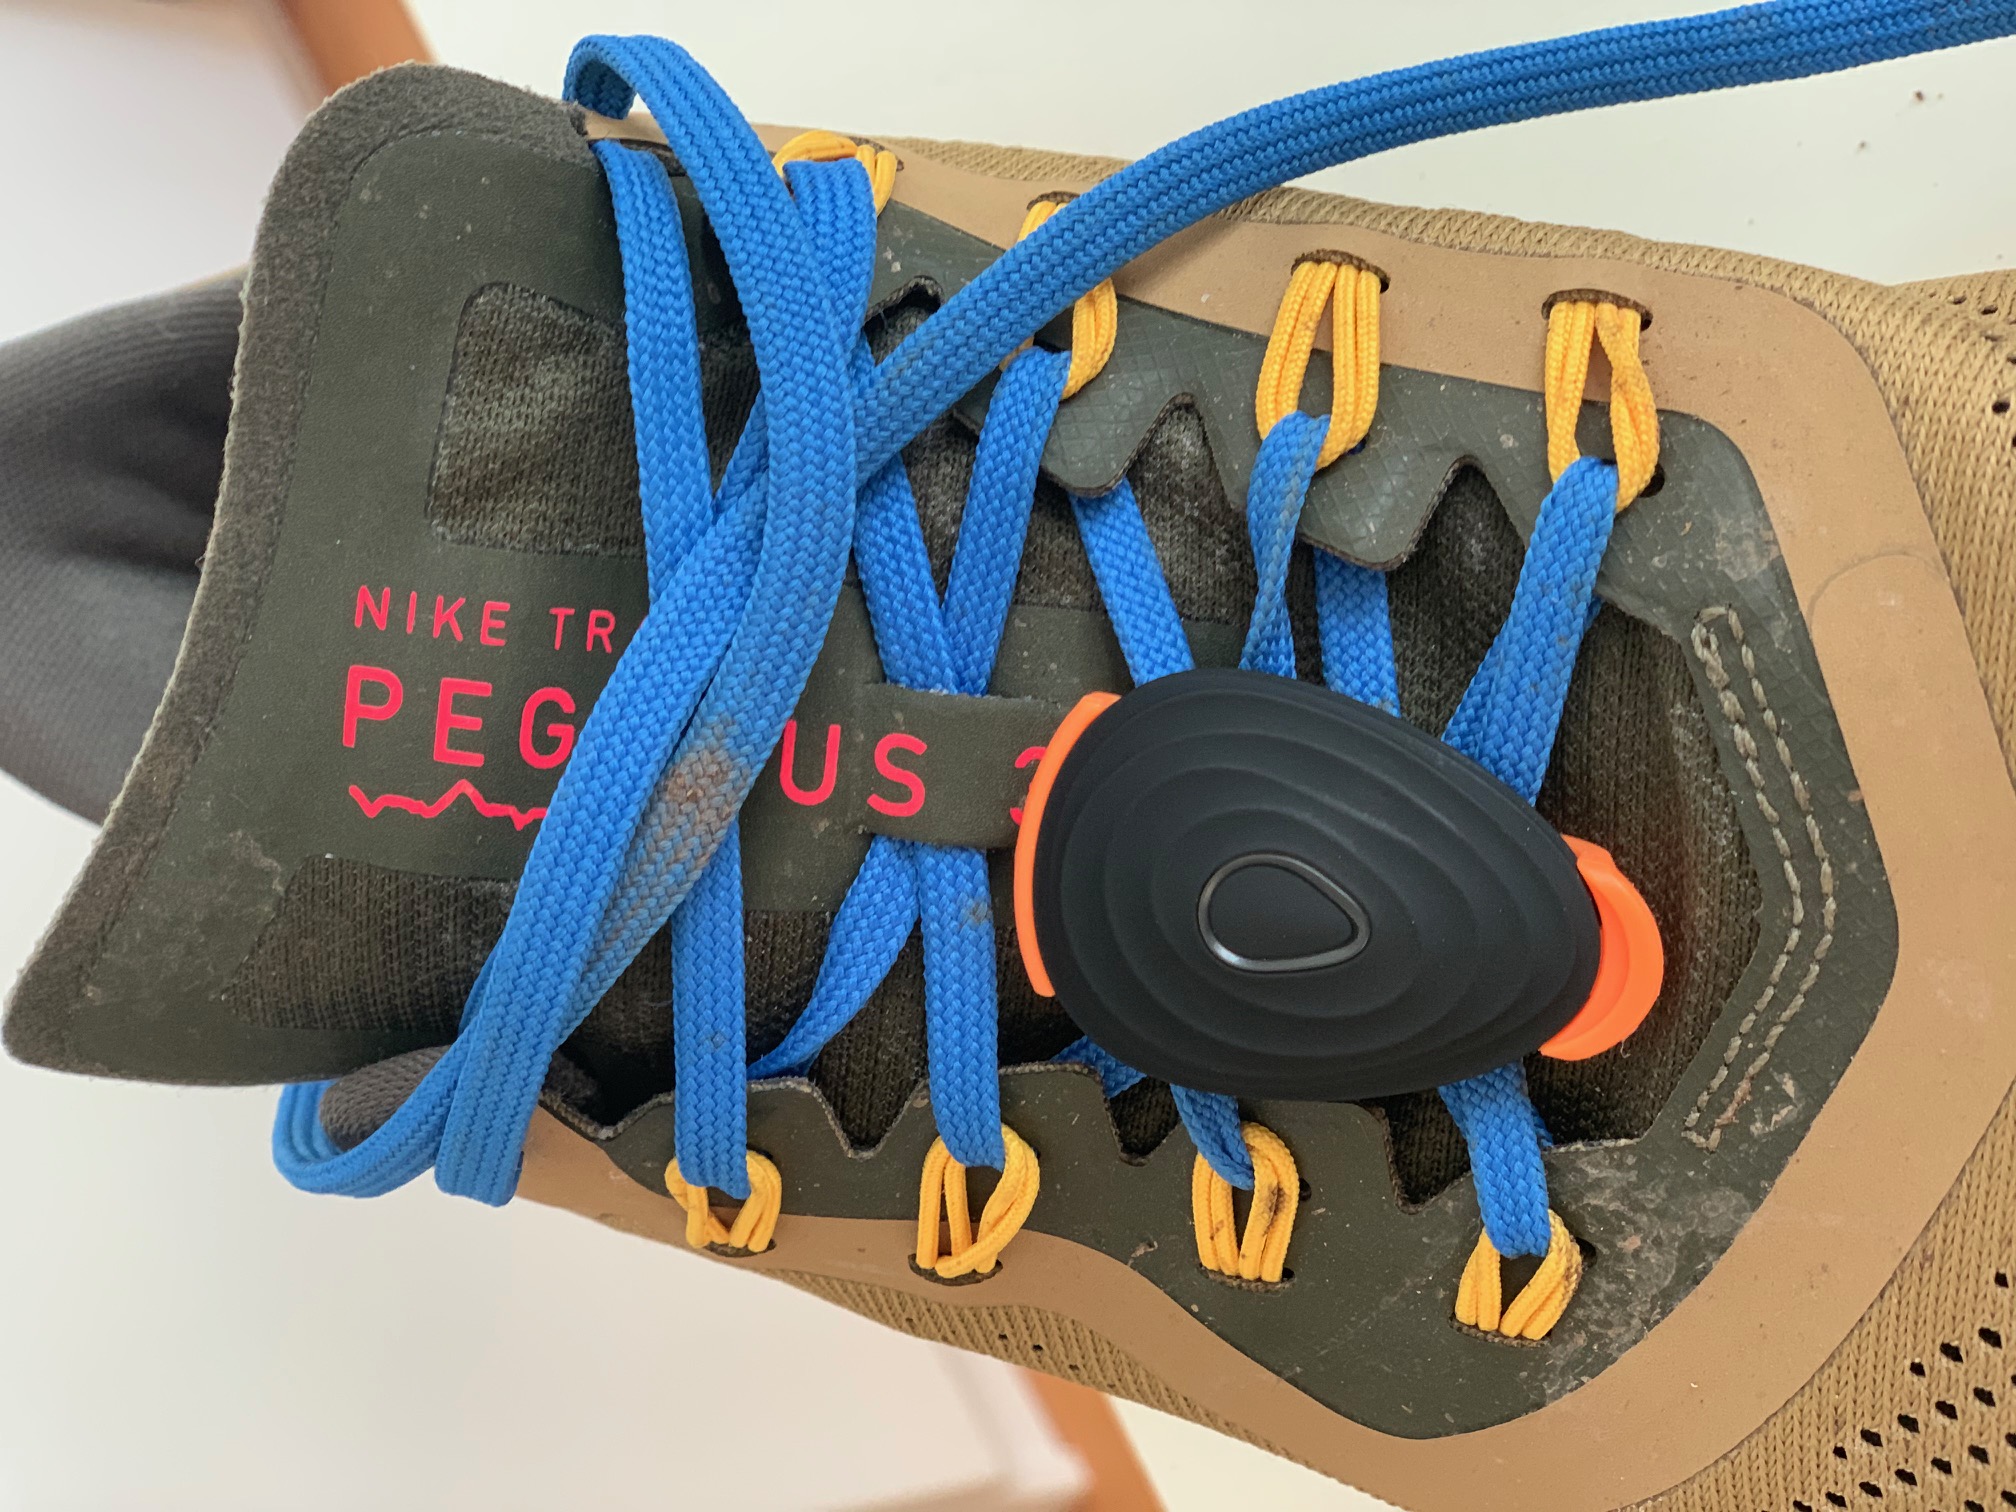
Sophisticated AI-based calculation of running power (power output in “Watts” for running) in several panels and the report generated for running tests. This feature can be used, e.g., to control and monitor training loads by STRYD-devices):
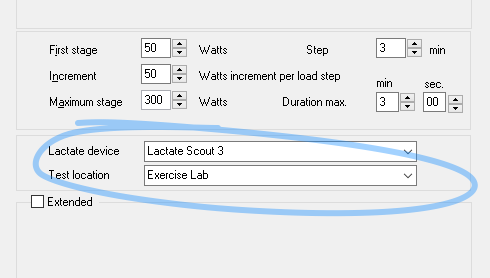
Additional data-base fields for lactate measuring device and testing location with self completion
Added some fields (e.g., test location) to the export/import function
Rowing ergometry analyses now come with calculated distances and rowing speed according to the performance in Watts:
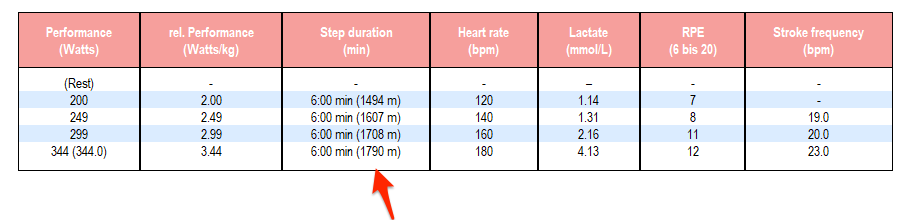
New prediction engine for rowing performances on common distances:
Predictions for rowing between 500m to 6,000m distances
Optimizations
The “\(\dot{V}\mathrm{La}_{\mathrm{max}}\)” model algorithm with untypical lactate curves has been significantly improved
The color range from hot to cold (“\(\dot{V}\mathrm{La}_{\mathrm{max}}\)”) was improved
Several edits were improved with autocomplete functions (e.g., at the selective data export)
Calculation of training zones in relation to maximum heart rate now correctly results in relative power outputs at the then given heart rates
Bug fixes
UTF8-related misspellings in the xlsx-export are fixed now
Fixed errornous results in the training recommendations when correction of LT applies
Fixed a rare error that occurred with more than 5 training intensity zones when exporting to Excel
Fixed a problem that selection of tests from the history panel didn’t work properly
Fixed a problem with Dmax or Dmax,mod as training reference
Fixed a seldom error that caused sorting failures with multiple tests of individual subjects
Version 5.6.3 Build 78 – 2019-12-30
New features
Robust predictive determination for the maximum glycolytic power a.k.a. “\(\dot{V}\mathrm{La}_{\mathrm{max}}\)” from multistage testing protocols
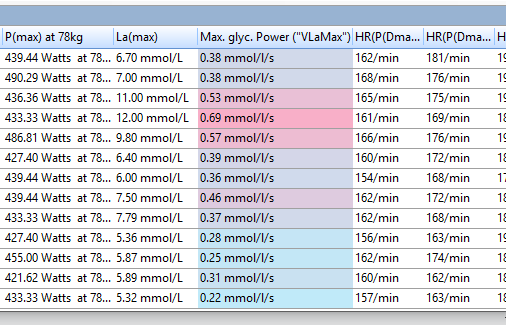
New data fields for test location and lactate measuring device
Bug fixes
Fixed wrong automated selection of the checkbox for LT correction in the the left hand panel
Fixed a crash on closing the application
Fixed a bug in the reports of the mountain run-test
Optimizations
Better rounded scaling for X-axis with irregular exercise protocols
Version 5.6.3 Build 51 – 2019-11-18
Bug fixes
Corrected letter head: In specific situations, line breaks didn’t occur.
Irregular protocols with only heart rate (lactate predictions) are now correctly shown
Some edits to the reports header lines where done
Stabilized the .xlsx export
New features
Standard STRAVA-Segments are shown in the report list (not only on the data panel)
New type of ergometry: Ski touring test with 25% treadmill slope